
SaaS-based deployments have a keen need for strong monitoring solutions. Customers usually opt for SaaS-based solutions because they get the following advantages for their solutions.
- No overhead of Operation – Operational overheads are taken care of by SaaS providers. SaaS providers will take care of provisioning infrastructure, maintaining it, monitoring the solution, etc. SaaS customers don’t have any responsibility for operational overheads.
- Scalability based on changing needs- As the use of SaaS solutions increases customers may face the issue of shortage of resources. To provision, additional resources autoscaling becomes an obvious choice but we should not allow the application to scale beyond certain limits. Having a strong monitoring solution allows us to keep track of infrastructure changes. If any new infrastructure is created as part of autoscaling there should be a mechanism in place such that it should automatically get added to existing monitoring. End customers don’t have to bother about scaling needs all provision will be handled by the SaaS provider.
- Cost Optimizations- Keeping real-time track of application behavior is essential but analyzing historical system usage and trends allows us to provision the right-sized infrastructure. Sometimes infrastructure may be overprovisioned by looking at historical data you can decide to scale down infrastructure to achieve cost optimizations.
- Secure environment – Security of data is often a concern to SaaS users while operating on the SaaS platforms. In the SaaS world, a major portion of handling security lies with the SaaS provider. If security is compromised then you may see unusual usage patterns of problems with your deployed services/infrastructure. A monitoring solution will help you to track such unusual usage patterns.
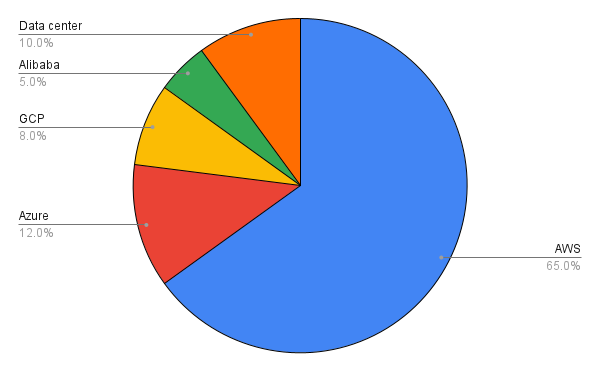
For one of our customers, their deployments of SaaS product is spread across various cloud provider. Yes, they have multi-cloud deployment. Since their entire product is containerized it can get deployed to any cloud provider which supports docker.
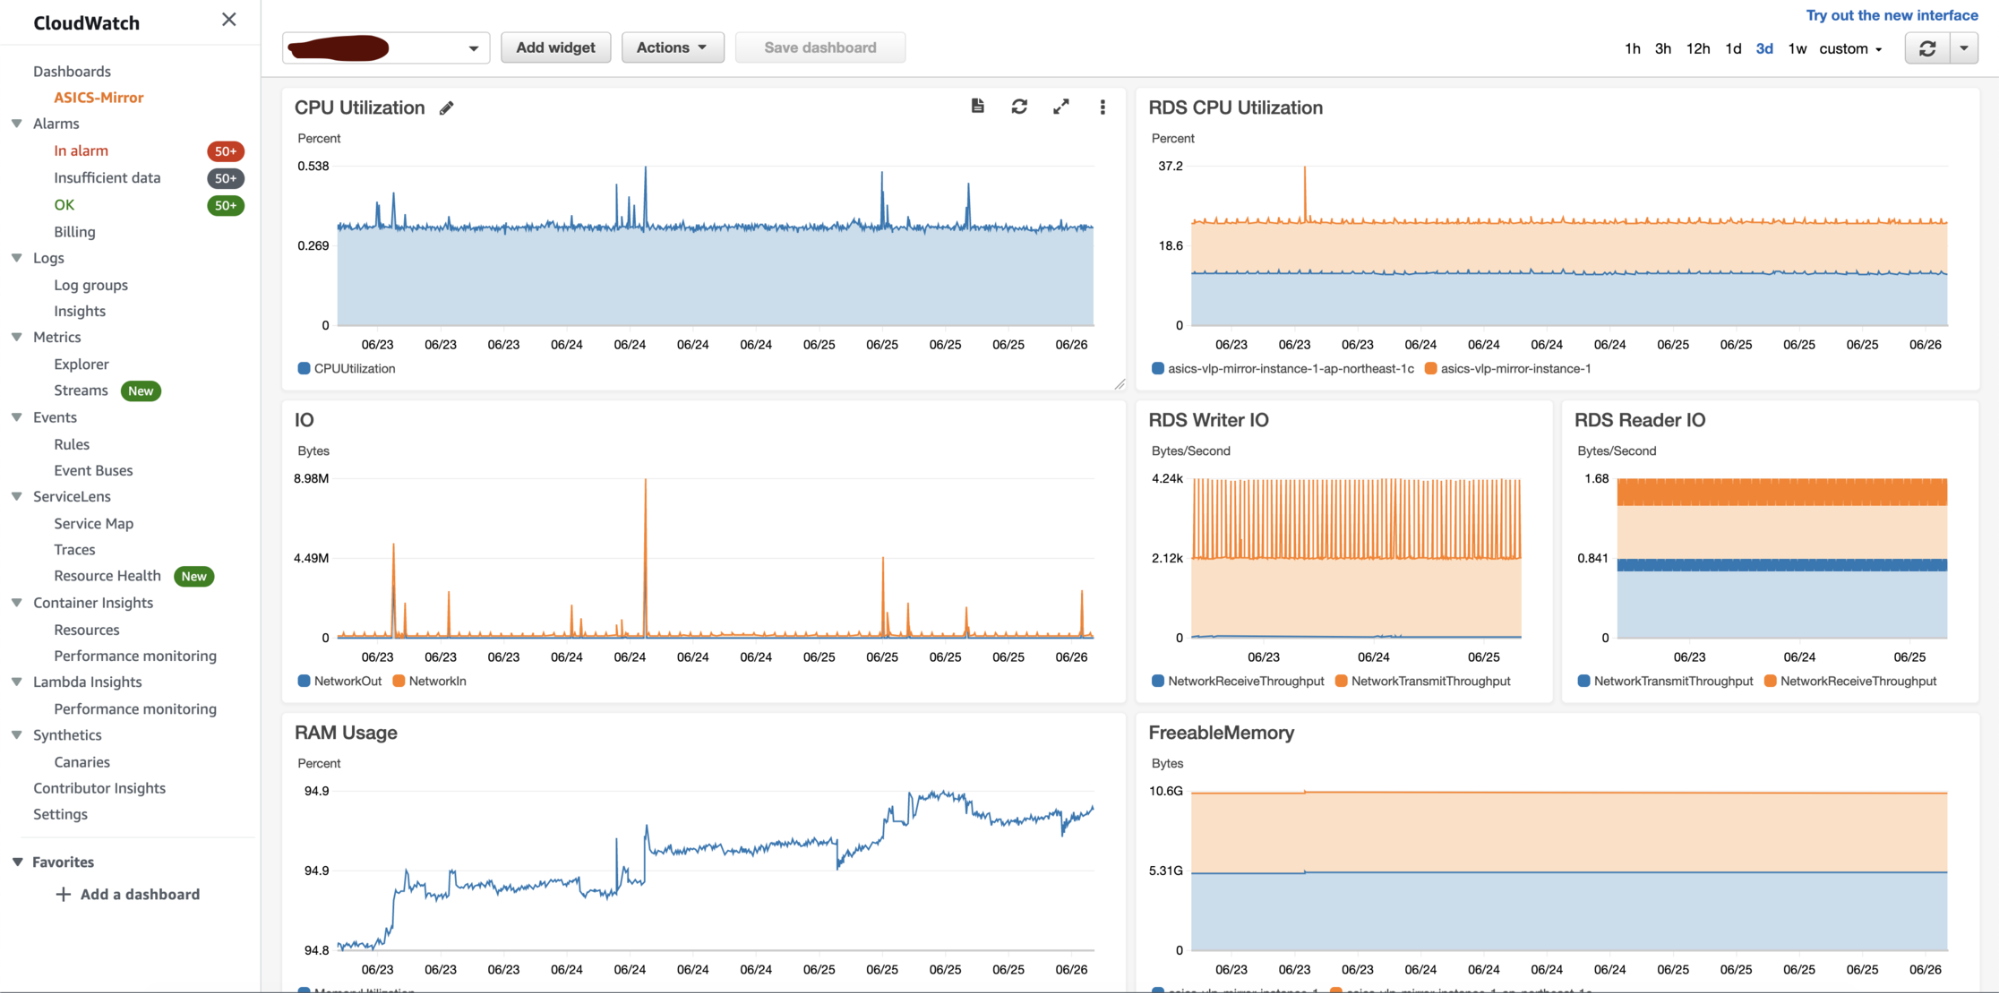
As you can see the majority of the deployments are on AWS. We built the SaaS solution for AWS first and hence for monitoring our choice was AWS Cloudwatch. Cloudwatch allowed smooth integration for closely monitoring AWS resources. We were able to track resources for customers by creating dedicated dashboards for them.
Cloudwatch is awesome but since we were having multi-cloud deployment we needed a solution that can give consolidated monitoring under one umbrella. We opted for Nagios as the existing support team was already using it to monitor their datacenter workloads. Nagios is an open-source infrastructure monitoring platform but has wide community support and has a wide variety of 3rd party integrations.
One of the challenges we faced during the implementation of Nagios was the automatic monitoring of services/infrastructure. Whenever new AWS resources are created using IaC their entries should be automatically made into Nagios. IaC plays a vital role in doing SaaS-based automated deployments. Read more.
This problem we solved by using Nagios’s API. Nagios has APIs for creating and configuring monitoring services. Even if you are configuring your own custom service it can be easily created using API.
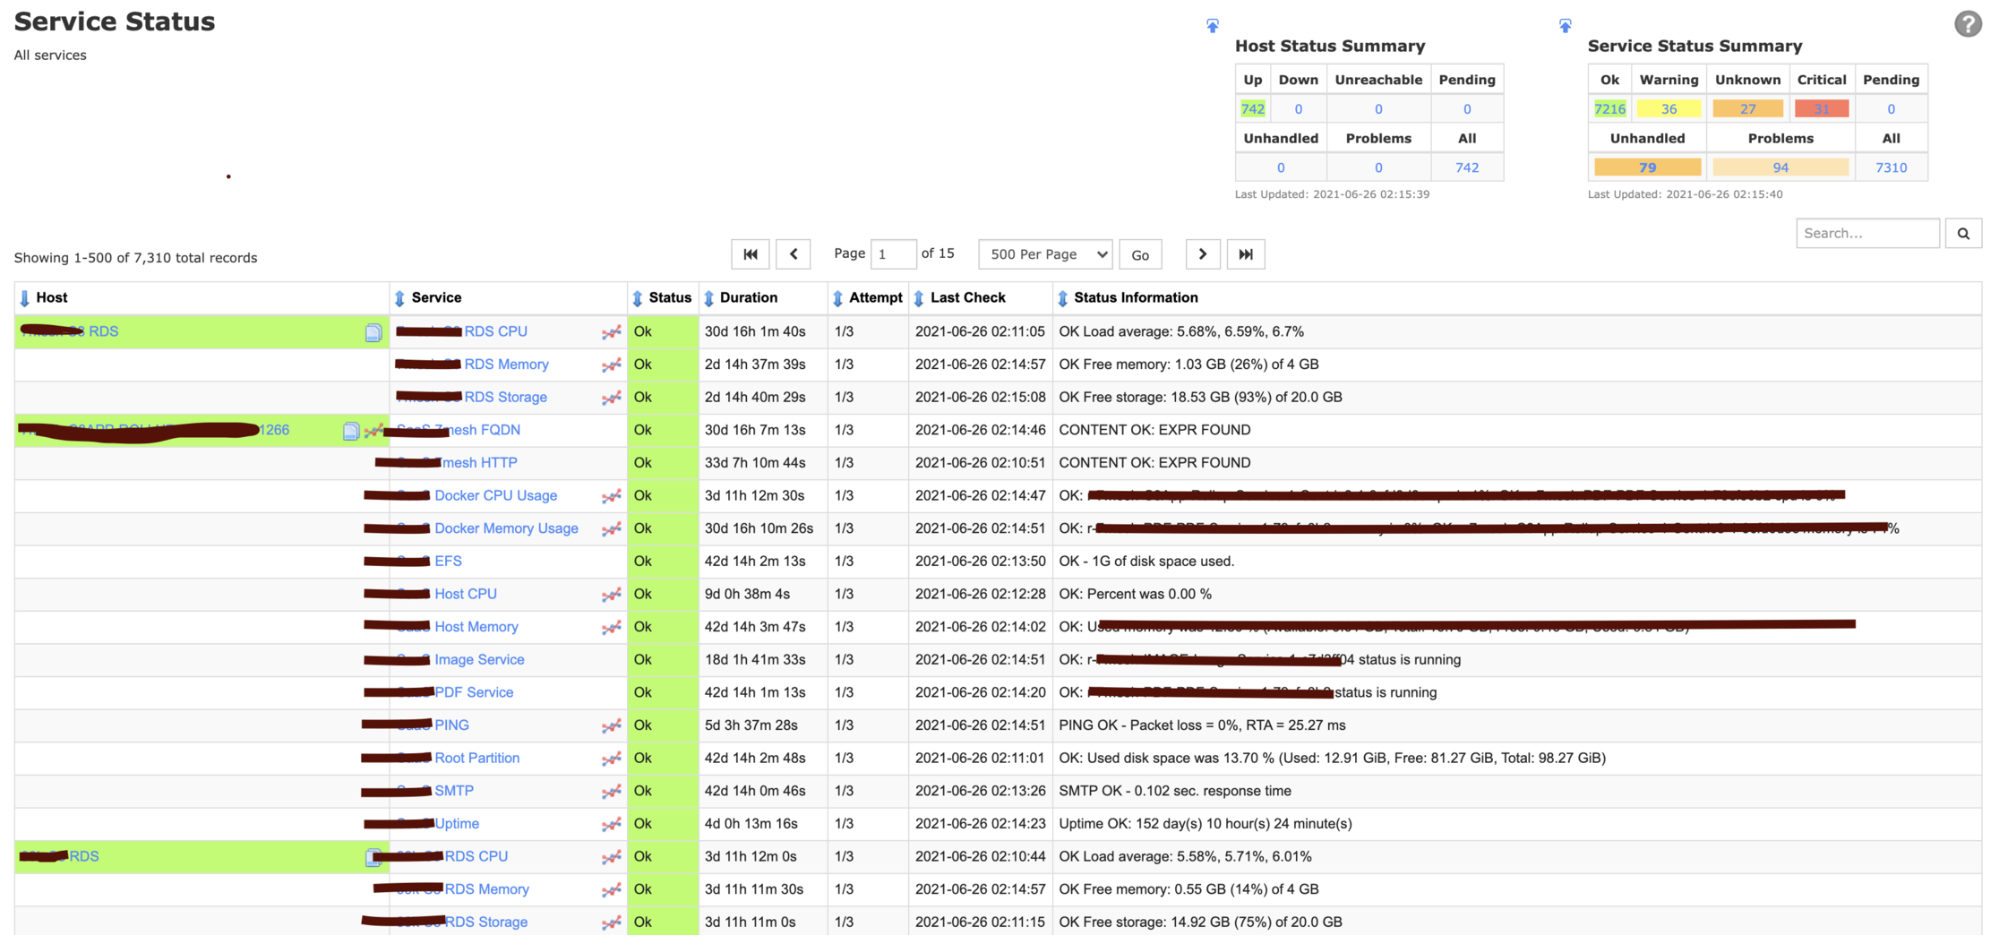
Another challenge we faced was not all services are supported by Nagios out-of-box plugins. But the beauty of Nagios is we can create our custom plugin using Shell, Python, Perl, or Ruby and can use it for monitoring. We wanted to keep track of EFS usage. SaaS deployments were using EFS to share data across EC2 instances. EFS by nature is elastic and can support the growing needs of customers easily. However, we wanted to restrict each deployment’s usage to 250GB as it was the part of SLA. There is no direct plugin available to track EFS usage hence we wrote a custom plugin for EFS and imported it into Nagios.
#!/bin/bash
calculate_disk_usage(){
USED_DISK_SPACE=`du ${MOUNT_POINT} -s -BG | awk '{print $1}' | sed 's/G//g'`
if [ $USED_DISK_SPACE -lt $SIZE_FOR_WARNING ]; then
echo "OK - ${USED_DISK_SPACE}G of disk space used."
exit 0
elif [ $USED_DISK_SPACE -ge $SIZE_FOR_WARNING ] && [ $USED_DISK_SPACE -lt $SIZE_FOR_CRITICAL ]; then
echo "WARNING - ${USED_DISK_SPACE}G of disk space used."
exit 1
elif [ $USED_DISK_SPACE -ge $SIZE_FOR_CRITICAL ]; then
echo "CRITICAL - ${USED_DISK_SPACE}G of disk space used."
exit 2
else
echo "UNKNOWN - ${USED_DISK_SPACE}G of disk space used."
exit 3
fi
}
### ======================================================================= ###
### SCRIPT EXECUTION START HERE ###
### ======================================================================= ###
if [ -z "$1" ] || [ -z "$2" ] || [ -z "$3" ]
then
echo "Missing parameters! Syntax: ./`basename $0` mount_point/disk warning critical"
echo "Note warning and critical values will be in GB. Don't need to specify units while passing an argument"
exit 3
else
MOUNT_POINT=$1
SIZE_FOR_WARNING=$2
SIZE_FOR_CRITICAL=$3
fi
calculate_disk_usage
Here is the snippet of the custom plugin that we wrote which can give stats of EFS usage and various states like OK, Critical, Warning based on parameters passed.
If you are doing SaaS deployments in an automated way then you should also have automated integrations with Monitoring systems. Stong monitoring systems like AWS Cloudwatch, Nagios, Datadog, Dynatrace will allow you to stay on top of your deployments to meet all service SLAs.
About the author
[pods field=”blog_post_author”]
[pods field=”blog_post_author_bio”]