
As stated in part 1, this is an experience report from the author’s company where a more pragmatic, objective, and transparent model is being used to determine compensation. For most skills having a sufficient number of jobs and job-seekers, a market mechanism becomes operational. Ruling market rates are the most impartial and objective way to determine compensation.
Boundaries that define the “Job Market”
Four factors determine “market” for employee compensation:
- Geography- Inflation rates vary from country to country, depending on the economics of that country. Fast-growing economies such as China and India tend to have higher rates of inflation.
- Skills- Certain skills tend to be more in demand. Recently “Data Science” skills are in demand, which has resulted in better compensation for Data Scientists.
- Experience- A professional becomes better at his job as he gains more experience. This trend tends to taper off after seven years. At which point one can think of up-skilling to get a better job. The graph above shows how compensation reaches a limit after a few years in a job. The only way to break out to the next compensation level is by up-skilling to acquire a better job.
- Performance- If we do A/B/C grading for employee performance on the job, A-graders tend to do significantly better, and C-graders tend to do considerably worse than the average.
How to determine “market” compensation
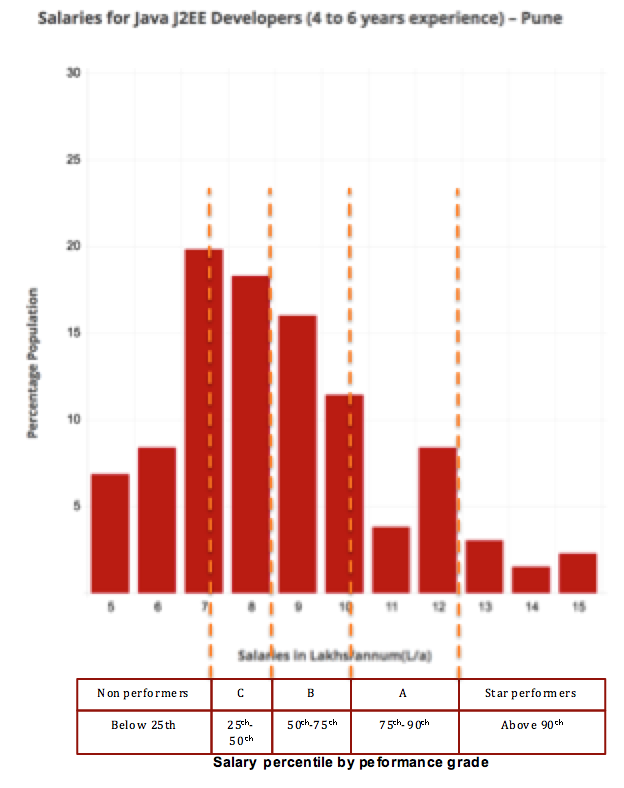
We can practically determine the ruling market compensation by taking a small, randomly selected sample. The sample should be large enough so that it results in a bell-shaped frequency distribution. We sampled candidate data sourced from job portals, employee, and agency referrals for certain job skills and experience range in certain cities. Please refer to one such frequency distribution in the graph below. We observed that most samples resulted in a slightly right-skewed bell shape for sample sizes as small as 50!
Model for determining compensation
The compensation model
We used these frequency distributions to build a compensation model that passes the following tests –
- Can the model be shared with all employees to bring transparency and objectivity
- Can the model manage non-uniform expectations based on skills and experience?
- Can the model lend itself to hire talent by offering excellent pay hikes to the new hires, without upsetting the loyal incumbents?
- Can the model account for special rewards for the superstars, thus avoiding ad-hoc negotiations?
Our company conducts quarterly performance appraisals in which employees are appraised of their last quarter’s performance by their immediate superior in an hour-long meeting. They can openly discuss and understand what OKRs they need to achieve in the next quarter to achieve an improved grade. We have successfully managed employees’ expectations by clearly linking percentile of pay level with grade achieved in an appraisal. (Refer to the table above) E.g., All “B” graders are paid at 75th percentile. There is total transparency as any employee can study the frequency distribution based on her technology skill and experience level. She can then decide whether to achieve better pay by up-skilling to a hot technology or to build more in-depth expertise in the same technology. As this model is based on the frequency distributions, it makes it much simpler to uniformly relate performance to percentiles across multiple experience levels and technology skills.
Here’s a link to the frequency distributions we have compiled based on samples taken from 28 technologies and five experience ranges. We have made this data accessible by writing a web-based application called Paywatch. Our company has been Paywatch for building our compensation model as described above. You may want to use this data, which is updated on an annual basis, as it’s open for all to use and provide feedback.
We have carefully drawn samples across various experience levels to compile the Paywatch frequency distributions. The report is categorized by technologies because hot technologies like AI and Big Data tend to have higher pay levels as compared to older technology categories like Java or Dotnet. Your company can be easily benchmarked for each of these categories and experience brackets. Companies can achieve transparency by using Paywatch to formulate a rational compensation model. The model can be made transparent as employees can verify the pay levels by using the Paywatch frequency distribution relevant to their technology skills and experience levels.
Results
This model is broadly known to all employees in the company. Those recommending pay raises have been briefed in meetings and via e-mail. We have been using Paywatch for the past three years for determining employee compensation. We have quarterly appraisals. A few (less than 1%) employees request reviews of the raises recommended by their superiors. Though Paywatch is open to all, not many employees use it to cross-check. This article is also an attempt to get our employees to use Payatch and provide their valuable feedback.
Initially, we observed that some managers were more lenient in grading and generous in recommending raises. These anomalies stood out as they were violating the Paywatch frequency distribution. We had to educate those individuals by asking them to justify their actions in writing. Some of these justifications were not valid. E.g., 50% of the team members can’t be top 5% performers. When we shared the feedback with all the managers, it resulted in a common understanding of the model. This helped us to bring uniformity and remove any individual bias. In fact, the model works so smoothly that recent raise recommendations needed no moderation or intervention by the HR department. There is so much transparency that no one is afraid of discussing her pay with others. A glitch in our payroll software had resulted in many employees getting pay-slips of many of their colleagues, which was very embarrassing for the accounts and the HR folks, but it didn’t result in any dissenting or attrition. There was no surprise for anyone there!
We use the same model for making offers to the new hires. That is the mechanism to keep us honest. The fact that most offers were accepted, and less than 1% of the offers were rejected on the grounds of low pay, validates that our model is well synchronized with the market. It also proves that we have successfully avoided having double standards in determining compensation for the new hires vs. the loyal incumbents. New hires are smoothly on-boarded and accepted by the incumbent teams as there is no secrecy about the pay offered.
Is this model the silver bullet?
We aren’t suggesting this as a silver bullet to address all the issues related to determining employee compensation. This is a sincere attempt to take on this big challenge instead of turning a blind eye. This is just a modest beginning. Employees, HR, and top management have to engage in a meaningful open debate using popular formats like fishbowl or breakout groups to discuss this topic and come out with a solution that is acceptable to all in the given context. Only then would we decide to accept-
- Solutions or partial solutions
- “Workaround” in the absence of a solution
- The overall agreement that there is no solution or “workaround” likely in the immediate future
- Long term changes that need to be implemented to avoid some of these problems
Is this the only way?
Many consultants would charge a fat fee to do a benchmarking study and recommend pay structures. Paid studies are good for getting a one time snapshot of pay levels – but it would be unviable to get your company benchmarked every year.
Popular platforms like Glassdoor and Payscale crowdsource the compensation data. Even if we assume that the information volunteered by the users is accurate, these platforms have no control over the sample – making it hard for them to draw statistical inferences.