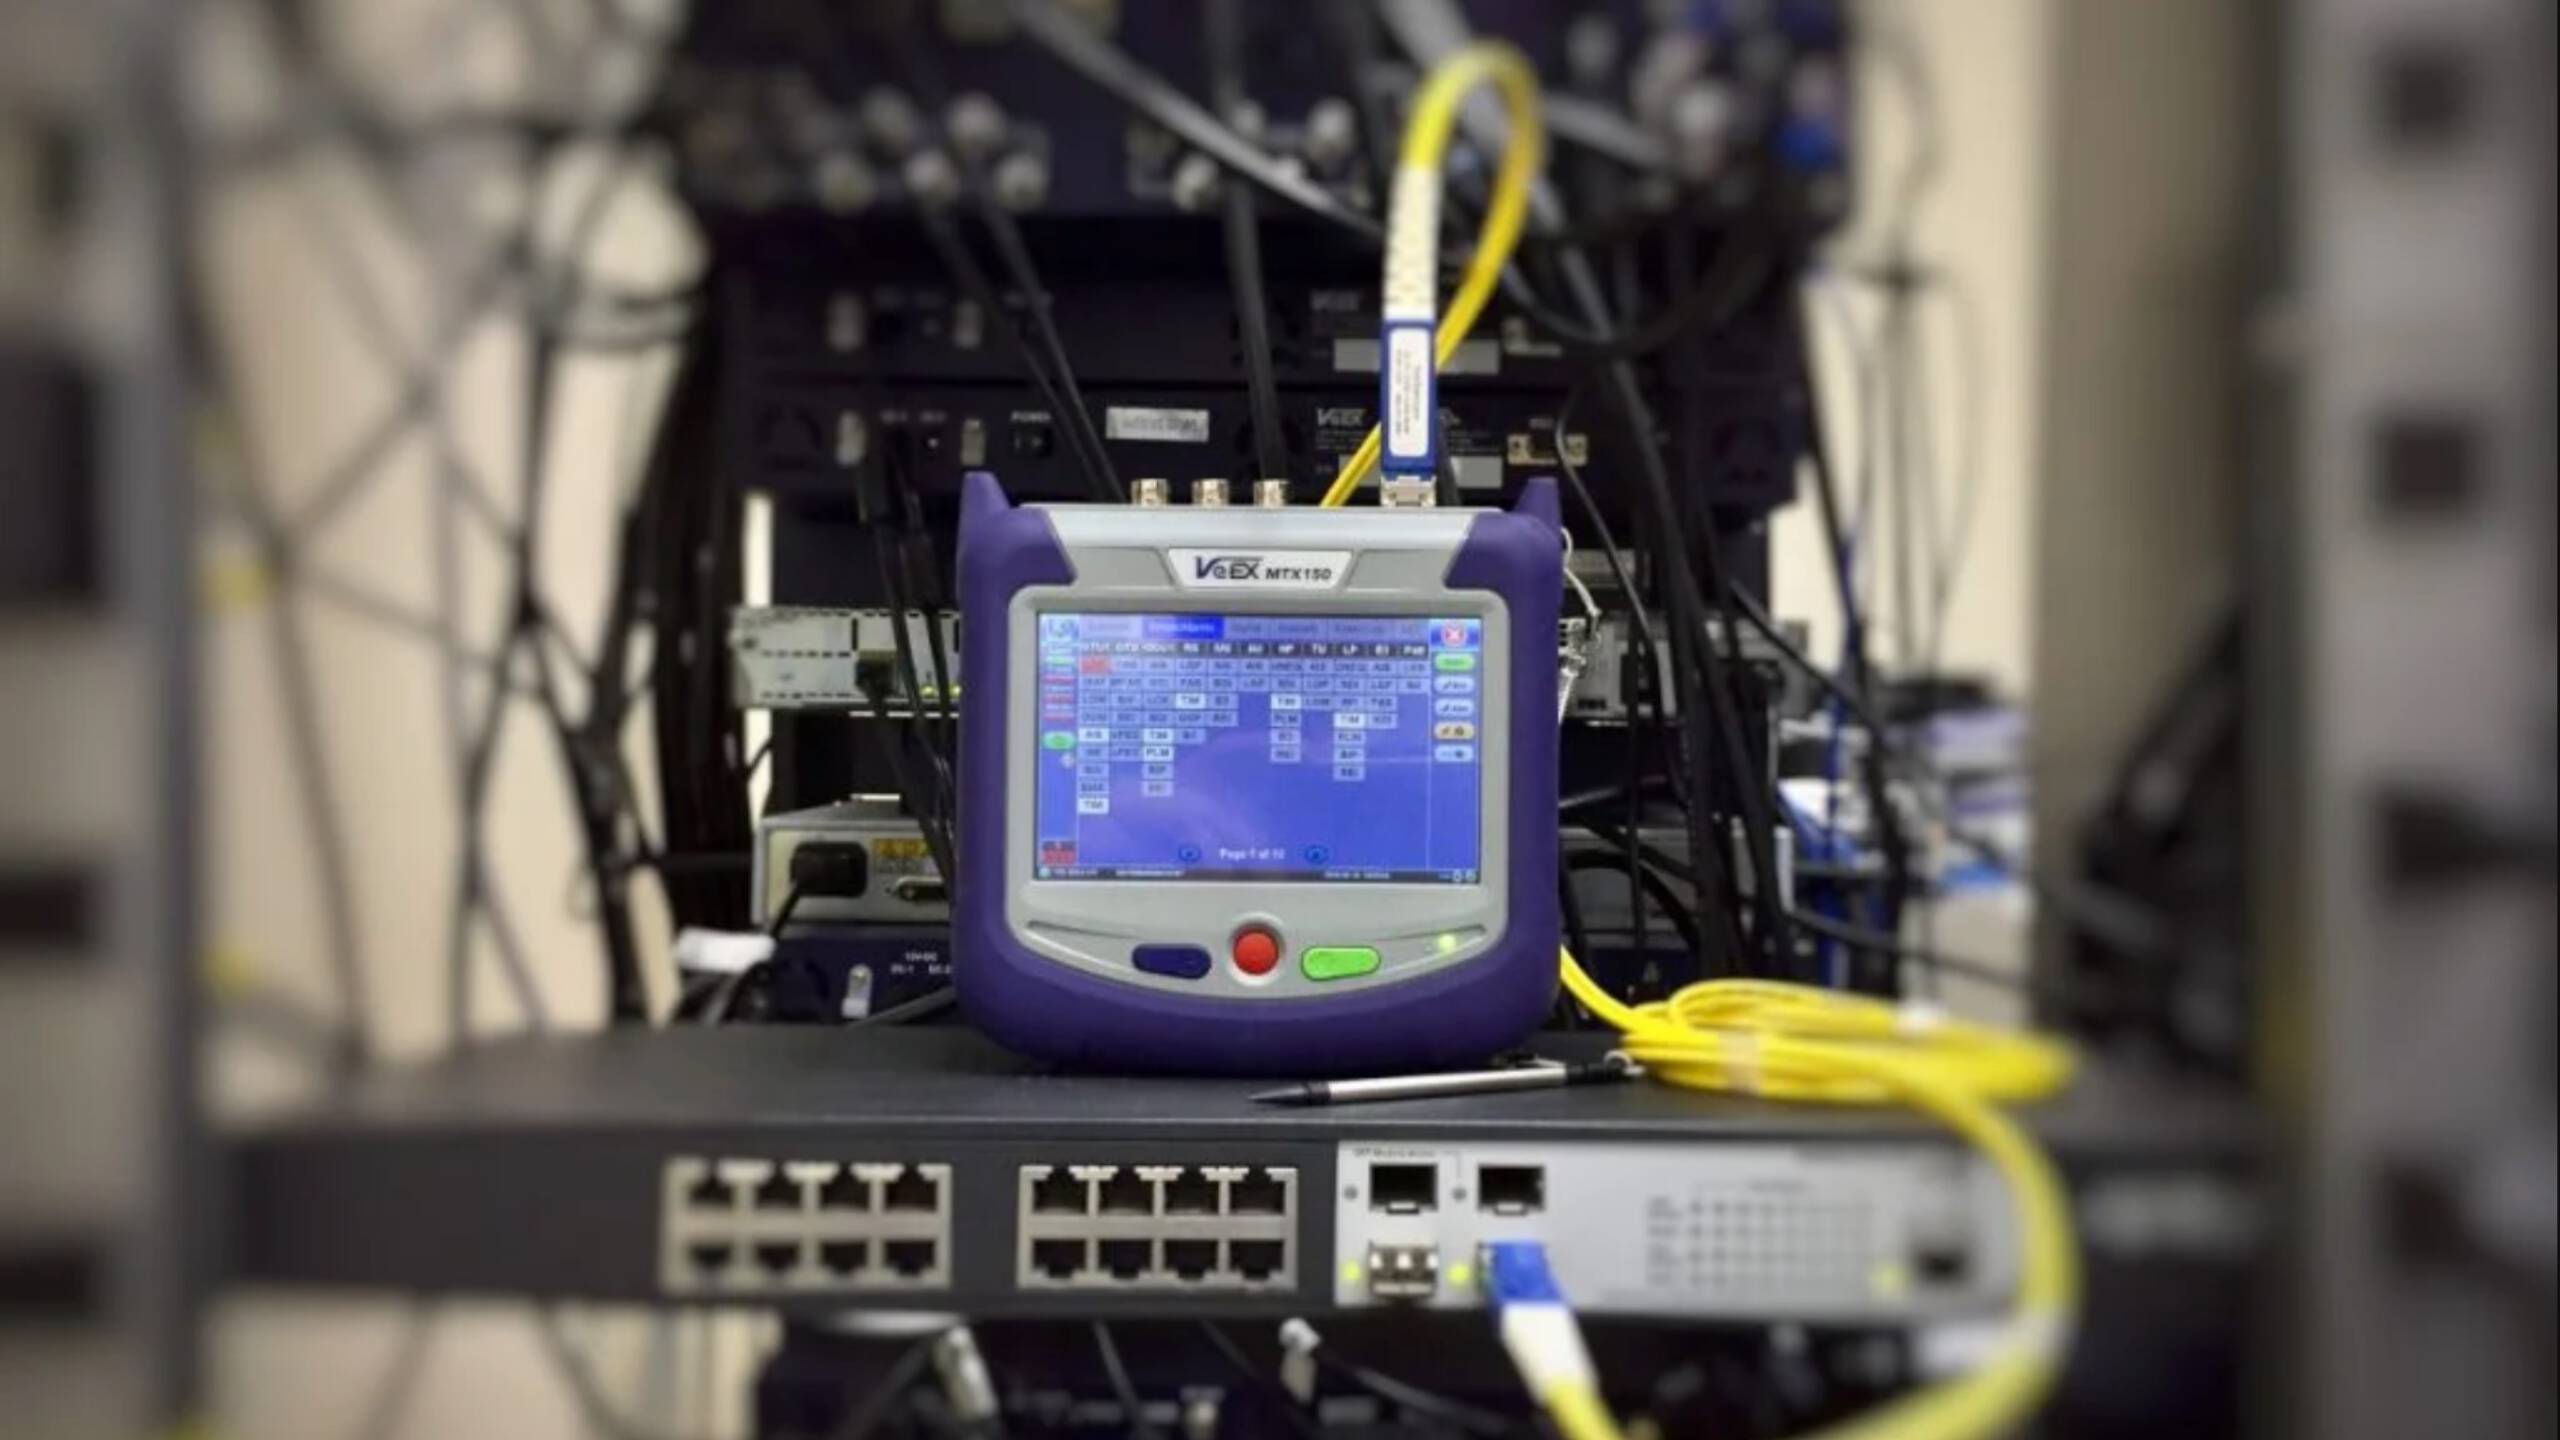
The performance of a web application is critical for today’s web apps. Poor performance may lead to lost revenue and dissatisfied customers. Studies by Microsoft and the National Institute of Science and Technology estimate that poor performance issues may be as much as 100 times more expensive to fix compared to finding it at the point the error occurred. A study by ThinkWith and Google, states that 53% of visitors will leave a site if a page does not load within 3 seconds. Hence performance testing is a crucial step to help reduce development costs, increase customer satisfaction, and stem the loss of revenue.
Performance testing tests a system for its responsiveness, stability, and reliability under various workloads. It is a non-functional testing methodology to ensure that a system performs well under its expected workload. This type of testing does not eliminate typical functional bugs but instead aims to do away with performance bottlenecks.
In this post, we describe a typical web performance test case in the healthcare industry. In this case, hospice care providers use the application under test to create events, schedule assessments, create visits, etc. The application in question also integrates with the Google Calendar module.
Scope
Typically, customers are unable to define the scope, performance acceptance criteria, or even performance benchmarks. As a result, Synerzip helps customers build PoCs and gather information to realize successful performance acceptance criteria. For e.g. in this specific case, Synerzip helped the client calculate the number of concurrent users using formulas and methods.
Typical scenarios that produce more data points in load testing are considered. In this case, fifteen most-used scenarios were considered. The overall goal or ‘acceptance criteria’ is to determine if the APIs respond within two seconds and identify and eliminate any bottlenecks that prevent the API from doing so.
The application’s micro-services architecture defines the SLA (Service Level Agreement).
Few basic points of note are:
- How many users will generate the load?
- What is the volume of data should we expect to create?
- How many users will use the application concurrently?
- What is the expected SLA?
Prerequisites
- Performance testing requires a dedicated exact replica of the production environment. This ensures that the results closely resemble real-world usage and what the end-user will eventually experience.
- An independent computer creates and runs scripts and is in the physical proximity to the application server. This gauges performance parameters by minimizing network latency and other variables.
- A significant part of performance testing is the data set creation. Application developers typically create this dataset. However, advance planning is necessary if the testing team is to create this dataset, as this may take time and affect the delivery timeline.
Tools
- Jmeter 5.0, an open-source and widely used tool and is apt for recording and scripting. It features advanced scripting capabilities using Beanshell or Java JSR223 PreProcessor. Also, various listeners are available for reporting.
- Selenium + API automation generates the test data
- Collectl – Collects, transfers, and stores performance data for AWS EC2 (Linux) instances
- Glowroot – Application Performance Management to pinpoint performance bottlenecks in the code
Planning
The testing process executes in three phases.
- Developing scripts
- Executing scripts with an average of three executions
- Analysis and reporting
Development
Well written scripts save time and underpin load/performance testing. Script development typically consists of the following steps:
- Script development typically starts by manually executing a scenario and then verifying them with the quality analyst or the product owner.
- The exact steps to run the script are recorded and then grouped into transactions. Transactions are logically grouped APIs/requests for a single step or action.
- In the next step, we correlate and parameterize the scripts. We use the ‘CSV data config’ to provide the test data to the script
- In correlation, we capture the session id and associate it with all the APIs
- Handling the Authentication mechanism through scripts to make independent scripts
Execution
Performance counters are set on the app servers before executing any scripts. These counters monitor and obtain values such as CPU utilization and memory consumption. Users are grouped into batches of 1, 25, 50, 100, etc. This grouping is based on the maximum number of users for whom the scripts will be executed. Scripts execute thrice per group. Reports list an average of the three values.
Analysis and reporting
Reporting is a crucial step in the process. Synerzip has a well-defined Performance Test Reporting Excel template. The report has individual sheets to provide insights about specific aspects of performance testing.
- The “Summary” sheet contains overall key observations and highlights
- “Observations” contains
- A full list of APIs and their response times
- Data from performance counters such as CPU, memory, network details, etc.
- Information about bugs reported in the bug tracking system
Conclusion
As seen above, 12 bugs and three APIs cause performance bottlenecks. Fixing these and running another round of execution resulted in a 200% performance improvement.
The main intent behind Performance testing is to monitor and improve key performance indicators. It identifies system bottleneck and critical issues by implementing various workload models. Moreover, performance testing shields customers from various application development and usage pitfalls, thereby keeping them happy!


